
Michael Alexander looks around and notices that the snow’s not only gone, it never arrived…
The last seven decades have shown what appears to be another price revolution. The regular pattern of peaks and valleys in producer prices seen by Kondratiev has been replaced by one enormous upward trend. The long wave pattern seen by Kondratiev can no longer be detected, suggesting that it may simply have been a random fluctuation that happened to occur during the 140 years after 1790…
Anyone who has followed Long Wave economics for very long has to be wondering what happened to winter. Not in the Global Warming Climate Change sense, but in the sense that following the year 2000 or so, we were supposed to descend into the frozen depths of economic darkness according to a whole host of long wave prognosticators. Instead we got a recession in 2001, then some bubbles followed by a nasty financial crisis in 2007-9. The world’s economy has been holding together in some zombie-like stasis for a decade since then.
The K-Wave postulates that – for as many reasons as there are analysts – capitalist society is subject to a 70-year m/l cycle of great boom and bust. The Civil War topped one, The Great War topped another – they came in like generational tsunamis, harbingers of economic and social destruction unimagined and unimaginable. The idea has always been controversial,* and whatever one thinks of cycles, one has to admit that this one should have rolled over us almost 20 years ago. That’s more than a rounding error. At the very least it’s a model that cannot be projected into the future with any sort of specificity.
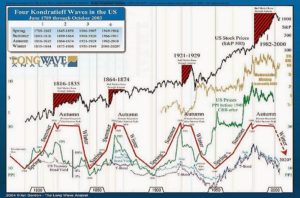
As evidence, I present the above chart, which I’ve stolen from Long Wave Analyst Ian Gordon**. Created in 2004, it had already proposed an 18-year autumn, about the longest on record. Its winter started in 2000 with the denotation that the S&P 500 had fallen back to the 1000 mark and the promise of a vicious decline to come. Two vicious declines and a decade later, that index stands 170% higher. The prophesied crash never came. If we had gone into a Kondratieff Winter on schedule, it would be about over, ready to begin the next bull market / Kondratieff Spring. So what happened?
This other chart happened. The K-Wave is the same, and when showed with the US Wholesale Price Index (now Producer Price Index) you can see a pretty good correlation. Until now. That red line going up at the end has continued to go up, even as K-Wave theory proposed it would drop quickly to 1940s levels. The theory is broken.
But why? I suspect that the Federal Reserve, by its ever-expanding currency operations, has broken the heretofore natural correlation between prices and the business cycle. Price levels, and therefore K-Waves under a gold standard or some other limited money supply, represented activity and demand in a concrete way: oversupply and under-demand led to falling prices. However, under an unlimited money supply system as we have today, the threat of falling prices is always met with more money, which dilutes the value of money, driving prices relentlessly higher in relation to that money.
Since we have changed the standard by which we measure prices, they no longer tell us anything but what something costs today.*** When the Fed separated prices from supply and demand, they broke the blue line by driving the red line higher. K-waves, which relied on rising and falling prices to give them form, were dashed upon the rocks of permanent inflation.
The question remains, of course, whether the Kondratieff Cycle still exists in any real sense. Alexander’s piece linked above (worth a read) seeks to re-discover it by making adjustments to how prices are measured, “correcting” the red line to show the blue still exists. I’m not a fan of changing measurements to find a pattern – it smacks too much of Global Warming Climate Change model manipulation. But whether he finds it or not, no one can deny that the decade following 2000 did not conform to the winter that the Long Wave analysts expected and preached. Fixing the chart will not change that fact.
So has the Fed delivered us into a Kondratieff Nirvana, where the cycles of history no longer apply? In Paul Krugman’s dreams. While this post is mostly a reminder not to place your trust in those who sell newsletters, waves and cycles still do exist, both in nature and in history. We should know within a few short years if the saeculum (discussed here, here, and here) is one of those that remains.
* Though I suppose no one found it as troublesome as did Kondratieff himself. He was executed in Stalin’s Great Purge in 1938, right at the end of the last Kondratieff Winter.
** for a couple of reasons, none of which are making fun of him for being wrong.
*** I mean, how far is it to Schenectady if the mile is increased by some random number up to 15% per year? How far will it be 25 years from now?


0.5